
Data De-Noise for Multivariate T2 and S-Charts Using Multivariate Wavelets
DOI:
https://doi.org/10.21271/zjhs.28.6.19Keywords:
Multivariate charts, Multivariate wavelet, De-noise, Threshold, Quality control.Abstract
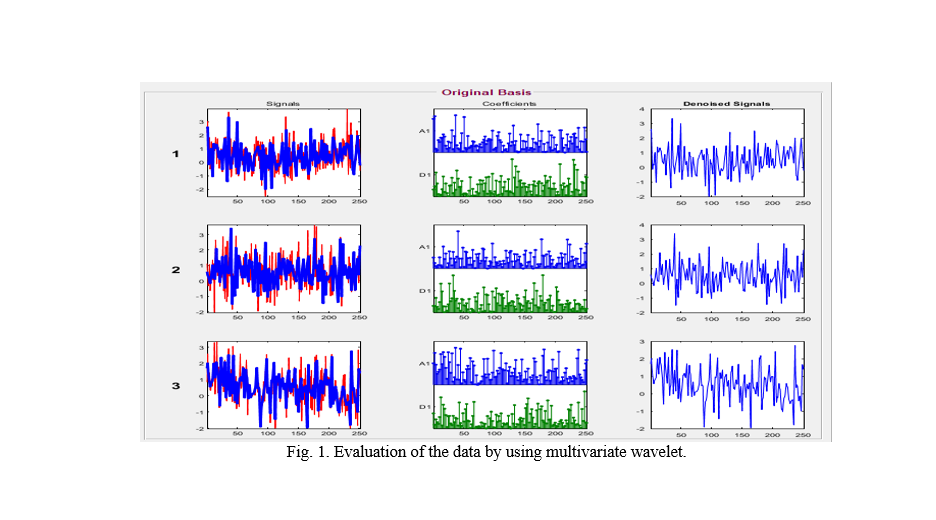
In this research, proposed multivariate charts were created corresponding to T2 and S-charts that are robust to noise data by using multivariate wavelet shrinkage, that dealt with the contamination problem before constructing Shewhart charts, through several different wavelets with (Baye), and (SURE) threshold methods, based on the rule of soft thresholding. It is then compared with the classical method proposed by Shewhart based on total variance (trace of the variance matrix), generalized variance (determinant of the variance matrix), and process capability. A MATLAB program designed to obtain the most efficient charts with the least contamination is used to simulate and use real data to get the most efficient charts with the least contamination. Based on the study's conclusions, the proposed charts are more efficient than the classical method in de-noising the data.
References
ALI, T. H., RAHIM, A. G. & SALEH, D. M. 2018. Construction of Bivariate F-Control Chart with Application. Construction of Bivariate F-Control Chart with Application, 116-133.
-Ali, T.H., Sedeeq, B.S., Saleh, D.M. and Rahim, A.G., 2024. Robust multivariate quality control charts for enhanced variability monitoring. Quality and Reliability Engineering International, 40(3), pp.1369-1381.
-BEST, M. & NEUHAUSER, D. 2006. Walter A Shewhart, 1924, and the Hawthorne factory. BMJ quality & safety, 15, 142-143.
-CAI, T. T. & SILVERMAN, B. W. 2001. Incorporating information on neighbouring coefficients into wavelet estimation. Sankhyā: The Indian Journal of Statistics, Series B, 127-148.
-CHANG, S. G., YU, B. & VETTERLI, M. 2000. Adaptive wavelet thresholding for image denoising and compression. IEEE transactions on image processing, 9, 1532-1546.
-DONOHO, D. L. & JOHNSTONE, I. M. 1995. Adapting to unknown smoothness via wavelet shrinkage. Journal of the american statistical association, 90, 1200-1224.
-FUCHS, C. & KENETT, R. S. 1998. Multivariate quality control: theory and applications, New York, Chapman and Hall/CRC.
-HOTELLING, H. 1947. Multivariate quality control-illustrated by the air testing of sample bombsights. Techniques of statistical analysis.
-JOHNSTONE, I. M. & SILVERMAN, B. W. 1997. Wavelet threshold estimators for data with correlated noise. Journal of the royal statistical society: series B (statistical methodology), 59, 319-351.
-JURAN, J. M. & GRYNA, F. M. 1993. Quality Planning and Analysis: From Product Development through Use. . discusses T2 control charts and provides a description of the steps for constructing them. McGraw-Hill.
-KAREEM, N. S., MOHAMMAD, A. S. & ALZUBAYDI, T. H. A. 2019. Construction robust simple linear regression profile Monitoring. journal of kirkuk University for Administrative and Economic Sciences, 242-257.
-MALLAT, S. 1999. A wavelet tour of signal processing, Elsevier.
-MONTGOMERY, D. C. 2019. Introduction to statistical quality control, John wiley & sons.
-NASON, G. P. 2008. Wavelet methods in statistics with R, Springer.
-SANTOS-FERNÁNDEZ, E. 2012. Multivariate statistical quality control using R, Springer Science & Business Media.
Downloads
Published
How to Cite
Issue
Section
License
Copyright (c) 2024 Dler Hussein Kadir, Rebaz Othman Yahya, Azhin Muhammed Khudhur, Taha Hussein Ali

This work is licensed under a Creative Commons Attribution 4.0 International License.


